下降楔形(Falling Wedge)是出現在上升價格頂部的一種常見形態。在價格出現上下小幅波動的整理期間,下降楔形可分為持續圖形和逆轉圖形兩種。 在持續圖形中,下降楔形呈向下傾斜,直到相遇現時的上升走勢。反之,逆轉圖形亦同樣呈向下傾斜,但成交則順勢下降。無論任何一種類型,這圖形都被視為看好。 下降楔形通常拖延至三至六個月時間,並能提供投資者一個警號 - 市勢正在逆轉中。下降楔形的形成,最少以兩點高點,以每點的最高及先前的最高點連成一條最高的阻力線 ; 同樣,最少以兩點低點,以每點的最低及先前的最低點連成一條最低的支持線。 股價經過一段時間上升後,出現獲利回吐,雖然下降楔形的底線往下傾斜,似乎說明了市場的承接力不強,但新的回落浪較上一個回落浪波幅?小,說明沽售力量正減弱中,加上成交量在這階段中的減少可證明市場賣壓的減弱。 在下降楔型中,股價上升,賣出壓力亦不大,但投資人的興趣卻逐漸減少,股價雖上揚,可是每一個新的上升波動都比前一個弱,最後當需求完全消失時,股價便反轉回跌。因此,下降楔型表示一個技術性的意義之漸次減弱的情況。當其下限跌破後,就是沽出訊號。下降楔形的出現告訴我們升市尚未見頂,這僅是升後的正常調整現象。一般來說,形態大多是向上突破,當其上限阻力突破時,就是一個買入訊號。 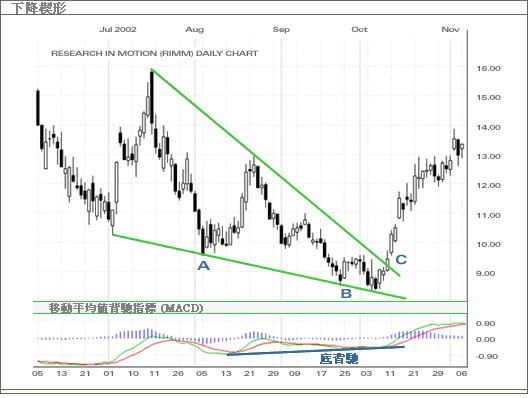
上圖是一個下降楔形例子,價格一直向下滑,以A點和B點相符的新高,分別形成兩個新低。但移動平均背馳指標(MACD)顯示,在A點至B點間的跌幅卻出現了底背馳。當下斜線與價格相遇,下漲趨勢沒有足夠的動力把價格推低,價格隨即升破C點的阻力位。上升趨勢因此而持續。 |