價格通道(Price Channels) 是延續圖形,它的斜度傾向上或向下,視乎它的價格成交集中於上趨勢線或下趨勢線之內。上趨勢線是一條阻力線,而下趨勢線則是一條支持線。當價格通道有向下趨勢傾斜時便視為跌市,而價格通道向上傾斜時,則視為升市。 以兩條趨勢線形成的價格通道,一條稱為主趨勢線,另一條稱為通道線。主趨勢線決定有力的趨勢。如上升(下跌)通道向上(向下)傾斜時,最少以兩點的低點(高點)連成一線而繪出。 另一條趨勢線稱為通道線,與主趨勢線平衡的。通道線以高點及低點繪出。在上升通道時,通道線是一條阻力(支持)線。在下降通道時,通道線則是一條支持線。 當價格持續上升並在通道範圍內波動,趨勢便可看作牛市。當價格未能到達通道線(阻力線)時,便可預料到趨勢將會有急切的轉變。隨後下破主趨勢線(支持線)時,便可提供確認市況將會逆轉。相反,當上穿通道線時,便可視為牛市及暗示價格將持續上升。 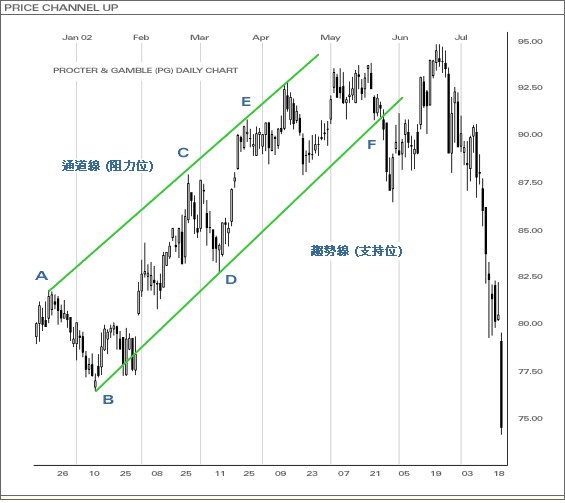
上述圖例,當價格離開上升趨勢後,一個上升通道開始形成。在整個價格上升期間,交易不能夠穿破A點,C點和E點的阻力線(通道線),縱使價格穿破由B點和D點組成的支持線,上升軌仍然存在,因為高位和低位逐漸上升。但最後,F點因太多沽盤導致穿破支持線。其實在F點前的價格沒有伸展到通道線時,已給發出一個警告訊號,表示缺乏購買力。相反,隨著價格繼續在通道內下跌或波動,走趨視為向淡。當價格越不接近通道線(或支持線),即表示將發生的會是趨勢變動。如穿破阻力線,代表現時的走勢將有變動。如穿破下通道,即代表向淡及持續下跌。 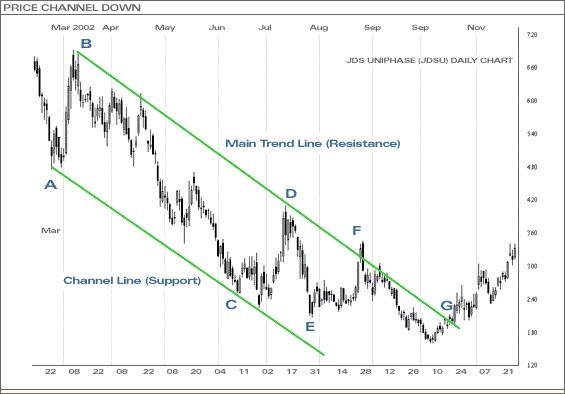
上述圖例,當價位離開下跌趨勢後,下跌通道開始形成。在整段價格下跌期間,交易不能穿破A點與C點的支持位(或通道線),縱使價格穿破B點和D點組成的阻力線,下降軌仍然存在,因為高位和低位 下降。雖然F點已破阻力,但穿破G點才真正轉為上升趨勢。當價格沒有伸展到通道線時,E點已發出一個轉勢的警告訊號,表示價格持續受到沽壓。 |