上升三角形(Ascending Triangle)通常在回升高點的連線趨近於水平而回檔連線的低點,逐步墊高,因而形成往上傾的上升斜線,而在整理型態的末端,伴隨著攻擊量能的擴增,一般往上突破的機會較大。 股價在某水平呈現強大的賣壓,價格從低點回升到水平便告回落,但市場的購買力仍十分強,股價未回至上次低點便即時反彈,持續使股價隨著阻力線的波動而日漸收窄。我們若把每一個短期波動高點連接起來,便可畫出一條阻力線;而每一個短期波動低點則可相連出另一條向上傾斜的線,便形成上升三角形。成交量在型態形成的過程中不斷減少。 上升三角形顯示買賣雙方在該範圍內的較量,但買方的力量在爭持中已稍佔上風。賣方在其特定的股價水平不斷沽售,不急於出貨,但卻不看好後市,於是股價每升到理想的沽售水平便即沽出,這樣在同一價格的沽售形成了一條水平的供給線。不過,市場的購買力量很強,他們不待股價回落到上次的低點,更急不及待地購進,因此形成一條向右上方傾斜的需求線。 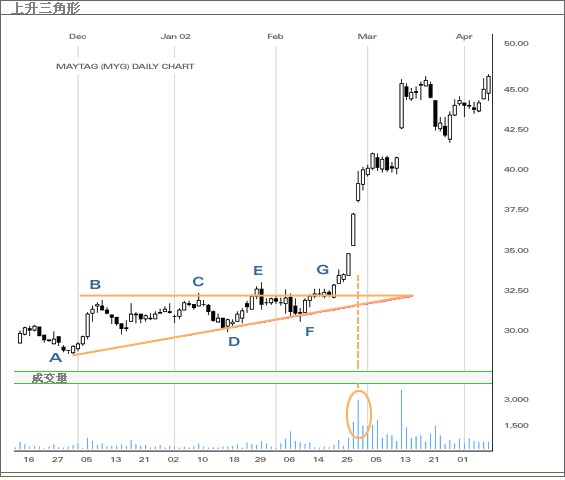
上圖為例,上升三角形在最初形成時,價格亦開始向上升。全個形態發生在三個月內,但並沒有穿破B、C及E的阻力線。而較高的低位A點王D點及F點,代表正在積聚及市況會續漸上升。在整個過程中,成交量比預期弱,但在F點開始趕上。而價格剛好受制於支持線及反彈升穿阻力位G點,而且G點的成交量很高。上升三角形形態確認後,市勢將會持續上升。 |