T�r�u�ιӸO�Q�r�u 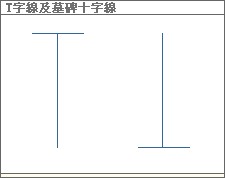 ���}�����B�̰����Φ��������O�ۦP�ɡA�K�Φ�T�r�u�A���먭�eT�r���A�U�v�u�ܪ��o�S���W�v�u�C����W�A���b�j��������ɶ�����W���A���R���H��N������^���e���������A�P�̰����ۦP�C ���}�����B�̰����Φ��������O�ۦP�ɡA�K�Φ�T�r�u�A���먭�eT�r���A�U�v�u�ܪ��o�S���W�v�u�C����W�A���b�j��������ɶ�����W���A���R���H��N������^���e���������A�P�̰����ۦP�C
�t�@�譱�A���}�����B�̧C���Φ������ۦP�ɡA�K�Φ��ӸO�Q�r�u�A���먭�e���T�r���A�W�v�u�ܪ��o�S���U�v�u�C����W�A�R��b�j��������ɶ�����W���A������H��N����������e���������A�P�̧C���ۦP�C T�r�u�ιӸO�Q�r�u������Y�A�P�Ҧ�������κA���ܦ����s�A�o���G�W�@���檺���{�C�b�^�����A�j����Φ��A�ά�}��������A�t�ܤU�^�Ͷռ�b�f��i��C�ۤϡA�b�ɥ����A�j����Φ��A�ά�}���O�����A�t�ܤW���Ͷռ�b�f��i��C
| 


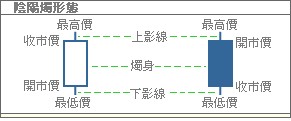 �@�䳱���륲���H�}�����B�̰����B�̧C���Φ�����ø�e�Ӧ��C���p���������}���������]�Y�C�}�����^�A�먭�e�L��Υզ⪬�A�F���p���������}�������C�]�Y���}�C���^�A�먭�h�e����ζ¦⪬�A�C������Ťߩι�߳���(�Y�}�����P��������������m)�٤����u�먭�v�A���먭�W�ΤU�����u(�N����Ӯɬq������d��)�٬��u�v�u�v�C�v�u�̤W�����N���̰����A�Ӽv�u�̤U�������h�N���̧C���C
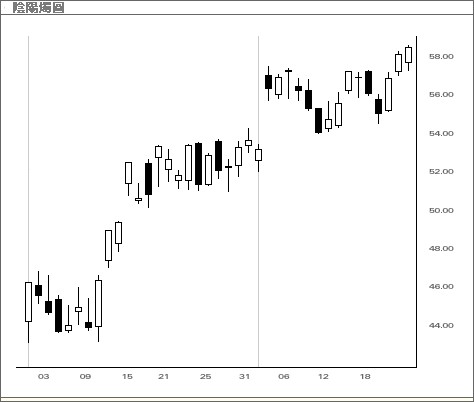
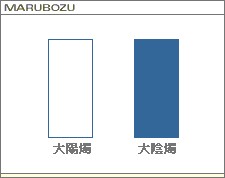 ������̤j�@�άO�j����/�j����κA�A���i��������(�W��)�γ���(�U�^)�C�j����/�j����κA�S���W�U�v�u�A�N��Y�զ⪺�j����A��̧C���P�}�����۵��A�ӳ̰����P��������O�۵��C�b�j�����Ҥl���A�N���R�a�Ѷ}�����즬���������ӥ����F�Ӷ¦⪺�j����A��}�����P�̰����۵��A�ӳ̧C���P��������O�۵��C�o�q�`�N���Ĥ@�榨���̫�@�榨��A������j�P���f�L���O�v�T�C
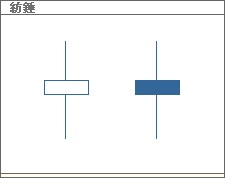 ������Φ��@�ӵu�ӲӤp���먭�A���W�U�v�u�o�ܪ��A�o�اκA�٤����u����v�A���ܶR��ۤ訤�O�����C�Y�϶}�L���Φ��L���u�����L���ʡA����Ѧ��ܲפ]�b�L�f���̰����γ̧C�����i�ʡA�R�a�ν�a�]��������u��(��������)�A���G�Φ������C
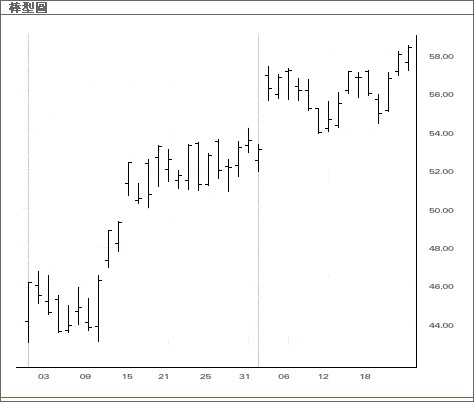
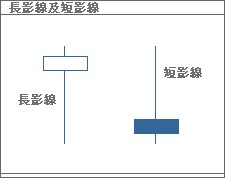 �P���褣�P���B�A�b��W�U�v�u�����סC��������Φ��@�ӵu�p���먭�A���W�v�u�εu�U�v�u�A�N���}�L�R��B��j�աA�N������V��m�A���b����ɹJ��f���A�Ϫѻ��W�ɨ����A���N������^��}����Ω�}���즬���C
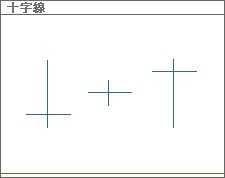 �Q�r�u��O�̬����n��������κA���@�C�ӬݤQ�r�u�κA�A�}�����Φ��������O�ۦP���C�b�Y�DZ��p�U�A�}�����Φ��������L���O�A���ä��h�C�Q�r�u���W�v�u�M�U�v�u�����צ����ܤơA�ұo�����G�i�����P�����k�C��O�@�ӤQ�r�u�A���i��N�������κ����A�]�����w����V���t�ܡA�D�n�O����h�ըä��Z���A���p�ݭn�M�D�s��}�C
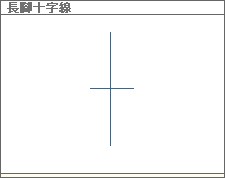 ���}�Q�r�u�O�Q�r�u�䤤�@�دS���κA�A����O�b��ܪ��W�v�u�Ϋܪ��U�v�u�C�b����L�{���A������еL�`�A���p���i�ʬ۷��@�P�A�Y��i�T��W�⸨�A�R�涡���O�����A�����B��������A�A���̫�^�_��}�����������C