|
Prosticks Articles
Hong Kong Economic Journal --- 17 July, 2000
ProSticks and The Random Walk Theory
Academicians often cite the Random Walk Model to challenge the
effectiveness of Technical Analysis. The Random Walk Model claims
that price behaves in a random fashion, and one cannot use
historical price information to forecast future price movements.
I agree that individual single price formations may be random due
to unpredictable political, economic, and market sentimental
factors. However, volume information cannot be due to random walk.
If a lot of volume occur at a particular level, that price level
must mean something. Otherwise, why so much money are spent at that?
Thus, the Modal Point and the Active Range, which are identified
based on volume distributions, cannot be random. They cannot be
easily manipulated too. Manipulating individual prices can be easy,
especially during an intraday period in which the market is quiet.
Manipulating the Modal Point, on the other hand, is difficult and
expensive. A big money player needs to throw in a lot of capital in
order to be able to move the Modal Point. Thus, while individual
prices can tell lies, the Modal Point and the Active Range cannot.
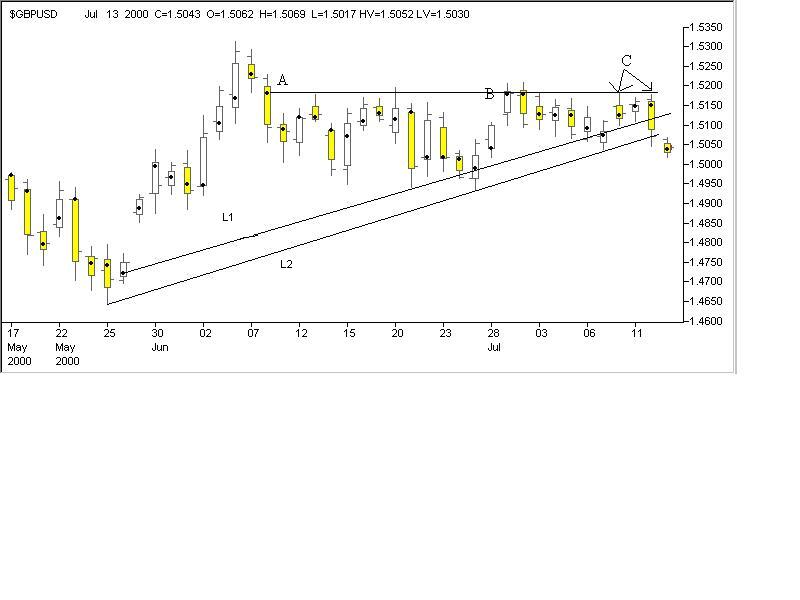
Figure 1 shows the Prosticks chart of the British Pound. Notice
that the Modal Point of A imposes resistance on prices
whenever price rises to its level on several occasions. Notice also
that the two adjacent Modal Points at B are at the near exact
levels as the Modal Point of A. Thus, it means that whenever
price attains the price level of A, a lot of selling pressure
comes in which pushes price downwards. The Modal Point of A
signifies some genuine market forces. Its formation cannot be due to
random factors. Moreover, the distribution of such market forces are
visible only on the Prosticks chart, but not on traditional Bar and
Candlesticks charts.
Since the Modal Points of A and two bars at B are
at the same price level, we can draw a line connecting them
together. This line is called a Modal Platform which is a strong
resistance level. As can be seen, at C, price attempts to
breach this Modal Platform three days in a row in vain, and
subsequently, price tumbles.
Notice also on the chart, we can draw two support trendlines. L1
is drawn using the traditional approach by connecting two nearby
major lows together. Another line, L2, is drawn by connecting
the corresponding Modal Points together. As can be seen, since L1
is above L2, those who sell when L1 is broken enjoy an
earlier trade entry point than whose who utilitize the traditional L2.
|